Bringing It All Together and Becoming an Infographic Maker Part 1
Lesson 20 from: Building Infographics in IllustratorJason Hoppe
Bringing It All Together and Becoming an Infographic Maker Part 1
Lesson 20 from: Building Infographics in IllustratorJason Hoppe
Lesson Info
20. Bringing It All Together and Becoming an Infographic Maker Part 1
Lessons
Day 1
1What Is an Infographic?
21:55 2Creating Adobe Illustrator Shapes
40:48 3How to Edit Shapes in Adobe Illustrator Part 1
17:41 4How to Edit Shapes in Adobe Illustrator Part 2
24:33 5Simple Adobe Illustrator Icons
46:07 6The Pathfinder Tool and Adobe Illustrator
28:06 7How to Create an Icon Part 1
25:40Icon Design Tutorial
29:19 9Rotate Tool and Adobe Illustrator
30:44 10The Shear Tool
44:27 11Adobe Illustrator Swatches
33:54 12Adobe Illustrator Effects
29:17 13Adobe Illustrator 3D
20:41 14Typography and Adobe Illustrator
34:37 15Illustrator and Text
32:18 16How to Make a Grid in Adobe Illustrator
18:12 17Adobe Illustrator Grid
26:52 183D Icons
17:42 19Pie Chart and Adobe Illustrator
18:01 20Bringing It All Together and Becoming an Infographic Maker Part 1
40:36 21Bringing It All Together and Becoming an Infographic Maker Part 2
44:48Day 2
Lesson Info
Bringing It All Together and Becoming an Infographic Maker Part 1
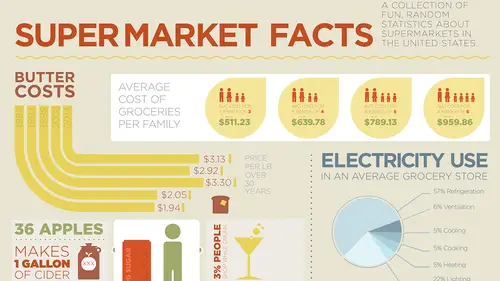
Okay, well we've got lots to do here 'cause we're gonna finish up a whole lot more information. So I copied a little bit more information over here as we're putting stuff together, and I think I'm gonna need to put some color in the background here in a little bit just to kind of get a little bit of contrast so I can start defining these areas here. But we're gonna start throwing some things together, been workin' on this little thing here, I'm gonna have to come back to that right here. Got a couple other pieces of fun information that we're gonna throw in here, just as little tidbits right there. 36 apples that's required to make one gallon of cider, and again, I'm just doin' stuff here that's all fun stuff that we find in a grocery store or a supermarket. So our 36 apples equals one gallon of cider. So of course this needs to be an absolutely awesome infographic. So I think the 36 apples becomes big, and equals the one gallon of cider is gonna be in its own container right there. An...
d choose a nice font there that's gonna work, and I think this needs to be all caps as well, kinda continue on with the tradition. And don't know if I need to make this green or I need to make this red. So let's see, got my eye dropper tool, green, dark red, I like the green apples, yup. 36 apples equals one gallon of cider, makes one gallon of cider, make that all caps too, there it is. Makes one gallon of cider. And I think that needs to be bold as well, that works. But now we need some pictures to go with this, don't we? We sure do. So I'm gonna grab that, but that needs to be thin, so I'm actually gonna make that light. All caps, reduce that in size, and makes one gallon, there we go, I think that needs to be bold so it gets called out. Make that large, there it is. Okay, we got that. So now we need to make one gallon of cider. Well of course we need a little cider jug, don't we? Cider jug time. How do we make it? No idea, but I think I'm gonna start with this, doin' my little rounded corner one, get my little jug-like fixture right there, and that definitely needs to be brown, no question about it. There it is, there's my apple cider jug right there, and then of course we need a little tapered edge, a little lip on that whole thing. Triangle time, polygon tool, draw my triangle, yup, parked it on top there. You're probably sayin' that doesn't look right, we're not done folks, not done, not done. We get the little taper there, bring that up so we get our little tapered edge, that's gonna go right to the edge there, um-hmm, yup, talking to yourself always helps. The more you talk to yourself, the better the infographics go. That needs to have less rounded edges, so I'm gonna bring that out, I'm gonna bring that little cap right down in there, and so now we're getting our little rocket-style thing right there. Gonna make that the same size and snap to it. Awesome, bring that right down in there so that fits, and it does have that little lip on there, doesn't it? It does, it's gotta have that little lip, which then requires us, yup, so a little lip, merge that together, awesome, there we go. This whole thing gets chopped off because we can't have this big, huge missile silo right there, so that gets chopped off there, right down, no, not merged, chopped. There we go. And then of course we have to have our little rounded edge cider cap right here, that's going to go like so, that's gonna line up right in the middle, and that's our little cider jug. Merge those together, and then of course, on top of this, I'm gonna do a little opening right there and that too needs a little opening too. Yes, I'm being a little bit crafty. Okay, then I have my little cider jug opening as well. Maybe I went overboard with the little lippy edges, but what the heck. There it is, merge it all together, boom. Of course we need our little happy jug handle. So we're gonna do an ellipse tool, do a rounded corner, flip the stroke, put that in there, bump up the stroke, put it there, reduce the size of our object, throw our little handle on there. Too much of a stroke, right there, got that. Hmm, looks pretty good, merge it all together, the whole thing becomes a stroke. Can't do that because we've got a stroke and a fill, put it all together, oh my gosh, jug of apple cider. I loves it. Okay, there's my jug of apple cider, and now I need to go ahead and put an apple on there because we need to know that this is apple cider. So makes one gallon of apple cider, that needs to be apple cider color doesn't it? Because yup, that's gonna be kind of a red, so we got our apple cider right there, there's a little cider jug, and apple. Great way to make an apple, okay, here we go, and I'm gonna make an apple. Take one of those, take one of those, put those together, merge the whole shape together, we have our little apple. I'm gonna squish it, make it a nice little apple, wow that looks good. And I'm gonna use my little arc tool, arc tool, beautiful. Put a stroke on that thing, boom, boom, boom. Go in, grab a color, make sure we got that stroke, very nice, do we need a, oh we need rounded ends on that. I don't know what my thing with the rounded ends lately, looks good, need a leaf, okay? Circle, we got this down pat don't we? Circle, flip this over, circle, there's our leaf. Take the two circles as they overlap, knock out what's left, take out what's there, move it down, reduce it, 45 degree angle, shift it, put it in there, reduce it down a little bit more, make it look good, group it all together, right there, reduce it, put it on there, apple cider right on the whole container. Yummy. There we have it. Container looks a little bit, well you know, that red probably isn't rich enough there, so I'm gonna go ahead and tweak that particular one and get it outta here. Ungroup the whole thing, go into my red, and I think we need to cut out the black in there, makes it a little bit orange, so magenta, there it is, more magenta, more magenta, there we go. Ah, much better. Group, slide it right over, apple cider time, beautiful. Love it! Um-hmm, there it is. You know what? I'd like a little dotted line right through here, I like dotted lines, they work really good. But you know one of the problems in Illustrator is do you ever try to do a dotted line in Illustrator? Watch this, craziness. Line, I draw a dotted line right here, and I go in to my stroke panel, let me go ahead and apply a stroke color to it, go into stroke panel, and I can do a dashed line. And it's like I can round the ends of my line here, and this is total craziness, I'm gonna do a rounded corner line, so I've gotta do my line, and I do my rounded corners here, and then I have to do my dash at like six points and my gap at like 12 points, and my six points and 12 points, and six points here, and 12, and it's like okay, so I have this, but now it's like okay, the dash needs to be like three points, 'cause I have to round and I have to physically make the little dots, so they do that, and it's like okay, that's even not enough, so I need to do a dash of two points to do that, to actually get my little roundedness. It's like are you serious? So now I've gotta do what, one point dash, a 12 point gap in order to get my lines to have little dotted lines on there. It's like okay, is that not ridiculous? I just want a dotted line, and it's like I've gotta go through all that. And so I reduce the size of my line and what does it do? It starts to squish out my circles because of course, I'm now changing the line. Okay, that's really annoying, seriously? And all the things that Illustrator can do, it can't just do a dotted line, it has to be a dashed, rounded line? No. Little trick here folks, InDesign, I'm gonna take the InDesign file and I'm gonna create a new InDesign file, I'm gonna draw a line. Guess what InDesign has? InDesign has dotted lines. Oh look, dotted line right there, awesome! Take it from InDesign, copy it, put it in here, paste it in there, oh look, dotted line. Thank you very much, that works great, thank you InDesign, thank you InDesign for doing what it is that Illustrator should've done. And yeah, there it is. Is it editable? It should be, if I go in and yeah, it's just a line, and let's see here if I can go here and actually edit it. So I can change the size of this here, no it doesn't look like it, it looks like I've got some funky stroke here or something like that, but I probably could go in here and I can expand the whole thing so that it becomes a fill and a stroke, right there, object, expand, expand the fill, or is that the stroke? So not really editable, but if I ever want a dashed line, there it is, okay? But it's really quite annoying to have to use this feature in Illustrator that doesn't work like it should. But anyway, there's a nice little graphic right there, stands quite cool, and you know, I think even with this, this just needs to be made white. I don't think we need to make it a color. There's my apple, gonna make this white too. So unfortunately that fill has to be white and that stem has to be a stroke of white, it's two different objects right there. Group it all together, group, put it on here, oh yeah, much better. They're askin' for triple X hard cider in the chat rooms. Okay, here it is, you want triple X? Alright, here, gonna grab this, oops, already thought of X, no that's command + C, X comes later. Paste it all, there we go. Select all, come on, XXX. Stroke, fill, outline, reduce in size, park it in the middle. There it is, hard cider, all you want, beautiful. There's my little infographic. 36 apples makes one gallon of apple cider, beautiful. Love it, fits right in that nice little space, fills it in, beautiful, next. Oh, by the way, apples ripen ten times faster at room temperature than when they're refrigerated. Ooh, now I got my apple, so now I'm gonna grab my apple, copy it over here, I think we need to go ahead and of course, apply color to it. Didn't we already have that color? Yes we did, and of course I needed to make it more red, take out the black, make it more red, grab my leaf, the leaf was the green, eye dropper tool, sample that, stroke was three point, it was green, switch that over, three point stroke, beautiful. Apple done, oops, gotta round it again because every time I flip the stroke and the fill, it always takes off all the attributes. Group, take that down, okay. Apples at room temperature, how do we show temperature? Easy, we do a nice little thermometer. So draw a thermometer, yup, we're gonna do our rounded corner box right here. Click and hold, rounded corner box, there it is, up arrow to get more rounded, 'cause I want a nice little round end of my thermometer. Perfect, swap the fill and the stroke, do a circle on the end of it right there, grab my ellipse, I'm gonna put a nice big bulb at the bottom right there. There's my thermometer like so, pathfinder, group it all together. Gonna go ahead and throw in some little hatch marks on there. So let's see, room temperature, that's going to be warm, yup. So there it is, that's warm, that's what we have, actually that needs to be the same color as the apple so it looks a little bit better. So room temperature, need to do a little bit of dividers in here, I'm gonna draw a line. Actually I'm just gonna draw a line right there. We need a stroke on this, yup, that stroke's gonna be white, to fill in there, it's also gonna have a little round-y end on there. Beautiful. Go through option, click and drag, ding, ding, ding, beautiful thermometer, group it all together, there's my thermometer, and now I need to apply my copy to this. This is Gotham right there, bold. It needs to be all caps as well, like so, there it is. Of course, ten times faster needs to be really bold. Is that how you spell ripen? Apples rippen 10 times faster. Take my eye dropper tool, select that font, get it all the same, cool. Now you know, I think I need to make that just a little bit bolder there. And an extra light, okay, that works, and then this is going to become black, yup, put that all together, make it look good. A little bit different font here, just we're gonna create a little bit more emphasis, there we go, that's lookin' good. Now I've got that, now I've got my apple. Put that in there, put my little apple here. I'm gonna put that apple, hmm. A little apple, well maybe that just becomes a whole entire block right here, I just expand that whole thing, and then gonna break that down. So now I got my apple, right here that I can kinda use over in this space, increase the size of it, and so, now we got my little temperature thing right here. So hmm, how do I show apples ripening faster when it's hot as opposed to when it's cold? I don't know, but I kind of like this, so I'm gonna copy this out of here and paste that over here, so I have 10 times faster. So now, oh this could be a perfect example of how we could go in and we could show a nice little chart. So oh, we could use our little pointers. Great, here we go, I know what I'm gonna do here. I'm gonna drag this down here, what I'm gonna do is I'm gonna extend the entire thing down here and we're gonna create an awesome chart. So I'm gonna ungroup this, and continue on down with my little spacing. Ooh that's not exactly the same is it? Nope, it's not. Okay, don't wanna delete the whole thing, there we go. So what I'm gonna do here is I'm gonna show a cool little way that we can do how these things happen visually. So here is a perfect way to do one of my pointers. One of my favorite little pointers, I go in and I use a circle like so, and then I use a stroke on my circle, I take half of the circle away, so I've got a little pointer like this, of course round the ends, of course little nubbins right here, and what this does is this is kind of like a little capture cone, like a little cone head thing. I put it there so you can kind of create something like that and then I'm gonna just go in and I'm gonna draw a line right from that thing like so, so it creates a little end, and it kinda shows you that particular point, and then you can see that when it's 10 times faster here, as opposed to ooh, where'd it go? As opposed to something like this, where if we have this little one down here, we do something like that, then we can go ahead and copy this whole thing right on over and I can drag it down here. Yup, see, nice little visual graphic right there. You have your little pointers. This needs to of course be a little bit more subtle, I don't want this to be that dark, and I think that's going to come down to kind of like the light brown maybe. Yeah, I think that's what we got. Yup, that's gonna work, and then of course the fill and the stroke right there. Need to go in, zoom in close, grab the fill, grab the stroke on that as well, awesome. That's going to be my color right there, I'm gonna drag onto that. That's gonna be my stroke, right there, boom, boom, two point, rounded ends, take care of it all, very good, there I have it. Nice little graphic right there, so oh you know what, we need our little ripen things right here. So what we're gonna do is we're gonna park that there and I'm gonna do a line right here and I need to have a stroke on that. There we go. Effect, distort, transform, zig zag, preview, smooth, not very much size, and then we can show you our little heat squiggles with of course rounded ends. And with our little heat squiggles, it shows you how the whole thing can ripen like so. Yes, I don't know, something like that. Group it all together, fit it all onto the size, scale the whole thing so it fits. Nice little infographic there, all flat, two dimensional objects right there. This needs to come up a little bit more, so now we have that right there. And you know, it's all lookin' good, nice little graphic, probably wanna integrate more of it here, but who knows? You know, maybe they get smaller and it gets put over here, you know. We got it, 'cause we gotta get this thing done here, you know, we've got an hour, and we've got a lot of bacon to fry up there. So this I think is also a little bit dark and I had just gone in and so I'm gonna use my eye dropper tool, and I think I'm gonna pick up just the brown color there and kind of knock it back a bit. Yeah, that actually looks good. And maybe that actually picks up the green edge there, and that's gonna reduce in size as well. Take that, yeah, likin' that, kinda swappin' out some of the green and the red, kinda mixin' it together there, so I can show how that works. Yup, okay, there it goes. So next we have people at the supermarket, oh my gosh, 3% of the people shop while they're drunk. Well, time for a martini glass. Yup, select the whole thing, Gotham is the font. Right there, yup. All caps, character, all caps right there. 3% of the people shop while drunk. Simple little infographic on this one folks, easy to do, we're just gonna park that right over there. Martini glass, awesome. Okay, first of all, triangle, so we got our polygon tool, triangle right there, yup, rotate the whole thing, even if you have to squish it a little bit, absolutely. And then we're gonna do our rounded rectangle as we go to get our perfect little stem like so, that goes in, lines up right in the middle, and then of course, we have to have our other triangle. That gets copied, flipped, flattened, put on the bottom right here, and we have our little glass, merge it all together. Beautiful. Do we need some little fizzy stuff coming off the top? Absolutely, because what says drunk better than little bubbles coming out of the top? Bubble, bubble, bubble, beautiful. Okay, nice color for that, yeah let's pick one. Okay, so we're gonna select the fill for everything here, and hmm, there we go, nice and yellow. There it is. Ah, that looks kinda good. We're gonna make this dark, I think think that could be kind of the red right there. Nope, I wanna pick up the red 'cause I'm gonna pick up that red, beautiful, right there. Okay, nice little graphic. Hmm, maybe those need to be blue, I think those need to be blue. Little fizzy ones, there we go, light blue. Beautiful, oh yeah, oh yeah. Look at that, um-hmm. There it is, nice little graphic, park that in the corner there. Fill this up. I think that can be reduced in size, a little bit lighter font. Make that big, and you know, maybe it's one of these things that I can go in and I can just rotate this, maybe fit it in here, and then just reduce the size of that overall so that then this can become the hero. Yeah, that works, you know, why not. Um-hmm. You know, part of me wants to do this too, so part of me is going to do this. I'm gonna take one of these little bubbles here and I think I need to just cross it over the edge here, and then I need to do the little knockout there, and then where I do that, there it is, and now we need to fill this with yellow. Actually, blue kind of works. Yeah, I still like the yellow. Um-hmm, maybe that whole thing needs to be yellow, just a lighter yellow. I think the yellow works, yup, okay, great, beautiful. Awesome, okay, that takes care of that. Now we're plunkin' all this stuff down, oh look at that, 20 ounce soda has 16 grams of sugar, and the average person consumes 45 gallons of soda a year. Oh, this could be fun, this could be really fun. So we need to do a soda can, don't we. Sure do. Problem is with a soda can is it's dimensional. So I don't wanna do a dimensional soda can, 'cause I can't. So 20 ounces of soda, 16 grams of sugar. So I'm gonna go and I'm just gonna draw a rounded corner rectangle like so, and I'm going to decrease the sides of this, and I'm gonna do kind of like a little soda can, but I'm gonna do a little trick here where with the soda can, of course, what happens at the top here, we have our little inverted corners like that, see? Rounded corners at the bottom, inverted corners at the top, delicious. Absolutely. So soda, hmm, what color is soda? Soda is going to be, it's not gonna be green, I think it's gonna be red, yup, there it is. Soda can right there, awesome. And I think with this one, we're actually gonna put the mount inside here. So I'm just gonna grab one of these containers here, and I'm gonna say 20 grams of sugar. Select everything on down, select everything on up, and then I can take this copy and use my eye dropper tool and I can select the lighter value here for that can, just so its not hugely impactful. Shift, scale, rotate, plunk into place, bring to front, select with everything, group it, scale it, fill it to the template, um-hmm, very good. So 20 ounces of soda, 16 grams of sugar, and we need to put the size of the soda in here don't we? Um-hmm, so I think we need to ungroup this, and I'm gonna do the same thing here. So 16 ounces of soda, but with this, I think I'm going to go in and make it thin, and I'm going to make it a lot darker as well so that we can see that and read that a whole lot better. I think that needs to be made a lot darker here, 'cause I'm not reading it very well. Okay, there we go. 16 ounces of soda, 20 grams of sugar. So the average person consumes 45 gallons of soda a year. 45 gallons, okay? So I think a really good thing here is we're gonna go in here and we're going to get Mr. Average Person, actually go back to my family here, here's Mr. Average Person, copy. And I'm gonna put this thing in here, and I'm gonna put it in there, and this little guy is gonna be, hold down shift and not control, there we go. Put it right in, and this guy needs to be what color? I think it needs to be green. There it is, Mr. Average Person. Yup, gotta keep his head attached. Group, there it is. So if he consumes 45 gallons of soda a year, we have to basically make him swimming in soda, right? Average person consumes 45 gallons of soda a year, so 45 gallons, okay, make this the whole thing. That's gonna become really big, and all lower case, yeah all lower case may work right here. So how do we show 45 gallons of soda? Um-hmm, well I could go ahead and I could repeat this whole thing, or we could just do really big drums, but drums also have dimension to them too, which is the problem. So 45 gallons a year, what does that equate to a day? How many things a day? I don't know. So I've gotta think about that, how I wanna do that, but I think what I really wanna do is I really like my little, these little things right here. I'm gonna copy this. Nope, I'm gonna copy this. Copy. Paste right there, and I think we need to do soda, little waves of soda, yup gotta do waves of soda like this, but we gotta do a lot of soda. So I'm gonna go in and soda is going to be, yeah, we're just gonna make it kinda like water so we can show the water portion of it. Nope, I want zero, not command + O. And zero, there we go. 45 gallons of soda a year. So of course we want them drowning in soda. So how do we actually fill up this guy with soda? Hmm, that would be really good, like how much he actually drinks, 45 gallons is an awful lot, how do you show 45 gallons? You know, we may just go in and take the soda here, and I'm just gonna take the soda can, I'm gonna reduce it down. So how many fluid ounces to a gallon? 128? 128, okay. 128 divided by 16 equals what, equals the calculator, 128 divided by is eight gallons, and it's 45 times 45, 360 cans of soda. 360, so I could draw 360 cans of soda here, which I could do really easily, and that may be a really good infographic, but I wanna do something really cool with the soda, 'cause I want to give it just a little bit of dimension to it. So I think what I wanna do is if I'm gonna draw this 360 times, which I'm not, I'm gonna go ahead and I'm gonna put a little highlight here just to make it look like some kind of brand-y thing. Take my eye dropper tool, highlight that as my little brand right there, got that, and I'm going to do that stroke right there, round the ends a bit, and I think I'm gonna have to lighten that just ever so slightly because I think it's gonna be a little bit hard to see when I reproduce this so many times. So I grab this, I'm gonna group this, and how many did I say, 360? So what I'm gonna do is I'm gonna take this and I'm gonna duplicate this 18 times. Two, three, four, five, six, seven, eight, nine 10, 11, 12, 13, 14, 15, 16, 17, 18. Great, okay. So that's 18 times right there, there it is, I'm gonna group those together, and I'm gonna scale those down so they fit in very nicely here, and so 18, and I now need 20 of those, right? Yes. So I've got two, three, four, five, six, seven, eight, nine, 10, 11, 12, 13, 14, 15, 16, 17, 18, 19, 20. Holy mother of soda. That's a lot of cans. That's a lot of cans. And you know, that's a lot of cans, and I think that makes a very good infographic with the number of cans. But I can't imagine havin' that many cans right there. One of the guys in the chat room said, what about a 45 gallon drum? Yeah, you know I thought about that. Pouring into his mouth is what he said. Yeah. I mean that looks pretty good, we can do that, if we did a drum, that's really easy to do too because I could just do a drum like this, and how I would then do that is I would just take, and I would create the little ribs coming out here like this for the drum, and you just duplicate that three times, 'cause they're always top, middle, and bottom, and you probably ask me why I would know that. So if I did that and I merged it all together like this, and I did that. Why would you know that? Well you probably were gonna ask me how I was gonna know that. So there is my 55 gallon drum right there that I could put, or 360 cans a year, and there is my 360 cans, that's a lot of cans. But then I'd have to do my super, oh you know what, oh okay, so I like that idea. I'm not gonna go ahead, I'm not gonna throw my cans away 'cause that took me forever to draw each one separately, good grief, this is what really slows down Illustrator. I think this would be absolutely perfect if we were to put this all together and we were to put this actually in the can. Yes, um-hmm, I think so. So I'm gonna take this, I'm just gonna create a nice little, actually I'm just gonna do this kind of as a gray, 'cause it'll be good as like a 20% gray right here. And then if I take my soda, I'm gonna park it in here, bring it to the front, group the whole thing, take Mr. Joe Average right here, and I'm just gonna make him solid white right there so he's no color, and then I can take my entire can here and stretch it, 'cause it really doesn't matter how those little bumps are, and I can bring this in here, bring that to the front, and can't have the soda can be as big as the guy. We can have him, I think with this I still wanna do all caps with that too, makes it different. And we're gonna truncate that so it doesn't. There it is. Make that kind of blocky like that. You know, and maybe that becomes our little infographic right there. Our big, huge, 55 gallon drum right there, I like that, I like that a lot, there it is. Okay, that takes care of that. Now I still like the cans here, 'cause the cans could go right next to this thing. But I don't think you'd recognize that as cans, those look like credit cards at that point. Yup, doesn't work. Yup, 'cause you can't see the little highlights, too many things, um-hmm. Alright, well we're gettin' a lot of things going on here, and I think we gotta put in some other full size infographics here, 'cause I think we're gettin' a lot of small stuff mixed up in here. So I think what I'm gonna do is I'm gonna take this down, whoops, picked up my butter pricing. Butter not do that. (laughs) I liked how you did that in a reverse, 'cause it kind of adds that dimensional to the graphics. Yup, absolutely, and I'm gonna do that more, because as I realize as I start to do this I think a little bit of color in the background, and then I'm gonna begin to call out the things with the background sections as well. I did this as a gray 'cause I didn't quite know what's going to work for me as well here, 'cause I didn't know if this was going to stay in here or not, 'cause it may be. That I think needs to be all caps as well, I don't know why I'm goin' all caps, but oh yeah, definitely. So that's kinda workin', well let me just shut off the grid structure here and see how things are workin'. I think it's lookin' pretty good. Okay, now 23,500 kids are hurt in shopping cart accidents each year. This is gonna be a fun infographic. (laughs) I've already got this one prepared folks, you know it. It's gonna be great. There it is, seeing as I have no children, I can make fun of them. Are in shopping cart accidents each year, I'm just gonna take off in the US. There we go. There it is, and I've already prepared my little shopping cart, and so, all caps with that too. I think the words accidents and each year need to be made big so we can see all that. Oh you know, in the US may work because that will make it all small again. Yup, I like that, kind of fills the whole thing out. There we go. Wanna see my infographic for this one? (laughs) I love this, family, there we go, where is it? Didn't we do, yeah we did the family right here, and I had this, oh yes, my little baby in a shopping cart. And gonna go here, paste little baby in shopping cart, oh that's great. Baby in shopping cart right there, but I think we need to take this whole thing, uh-huh, isn't it great? Group that together, and you know, this is so good that I think I need to actually do this, so we actually make room for the little shopping cart thing right there. There we go. So we do the shopping cart and I kinda bring this up around right here. Yup, there we go. (laughs) I like it, I like it a lot. Uh-huh, absolutely, or you know, even better, I'm gonna try this one. I'm gonna copy this, I'm going to rotate this, I'm gonna see how Mr. Infographic feels now. I'm gonna take this, ungroup this, and I'm just gonna take baby out, I don't know, isn't the same, is it? No. I kind of like the cart spillage. Nah, it's gotta be rotated, yup, final say, it's rotated, absolutely. I don't need to draw 23,500 kids, but it's looking good. Uh-huh.
Class Materials
Free Bonus Materials
Ratings and Reviews
Kathleen
I'm not even through the second day yet and I'm thrilled with this class! Only thing, I wish he would go slower BUT then again, if he did, we wouldn't get SO MUCH information. I'm glad I purchased the class so I can go back and replay to my heart's content. Even though this class is based on creating infographics, the wealth of information is perfect for any project using Illustrator. I do wish he would have shown how to work with corners (for example) for those of us who do not have CC (I'm in CS6) so we could learn the "hard way without widgets" and the easier way with widgets. Jason is very funny and I love his direct approach to getting the job done while knocking a clients socks off. I look forward to many more classes taught by Jason.
a Creativelive Student
Another amazing class from a man with a seemingly unbelievably clear mind. So great at conveying the concepts of the program so that you can effectively learn actual methods but also walk away with enough information on the way the software is organized so that figuring out a solution to a design challenge, on your own, is light years easier and faster. i am thrilled with the broader grasp of the possibilities i learned. i could go on and on. It is absolutely a class worth taking whatever your level of expertise.
Rozlen
Loved the class, learnt so much from Jason even if he talks a little fast sometimes he is still very funny and makes it look so easy, would love to buy his indesign class too love watching him, excellent teacher.
Student Work
Related Classes
Design Projects